Logging and visualization
NNablaNAS provides numerous tools to create visualizations and logging files based on the search space results. Most of these features are integrated into TensorBoard. Before going further, more details on TensorBoard can be found at https://www.tensorflow.org/tensorboard/.
Once TensorBoard is installed, we can write scalars, images, and graphs into a directory for visualization within the TensorBoard UI. To run TensorBoard, use the following command:
tensorboard --logdir=./log
Logging
All training curves during searching and retraining are logged for one experiment. Users can easily get access to these learning curves by running TensorBoard.
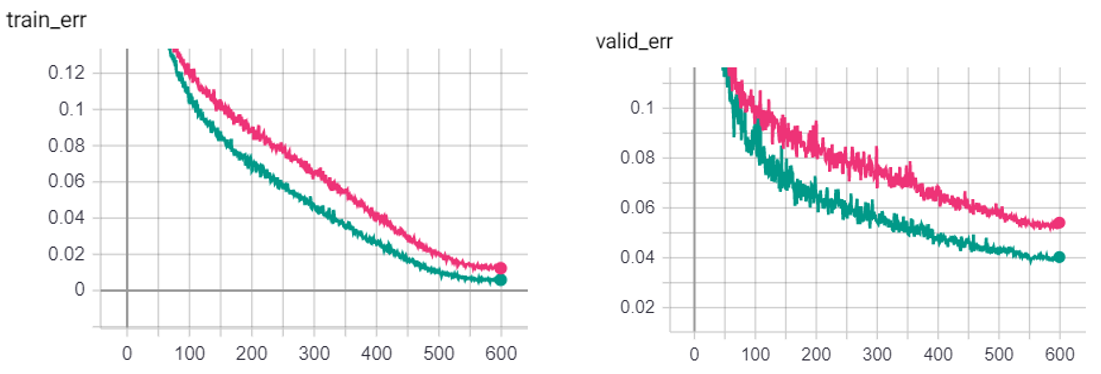
Fig. 1. An example of training and validation curves.
Architecture visualization
For some search space, we have provided functions to visualize the architecture learned during the searching procedure.

Fig. 2. A normal cell learned by DARTS algorithm.
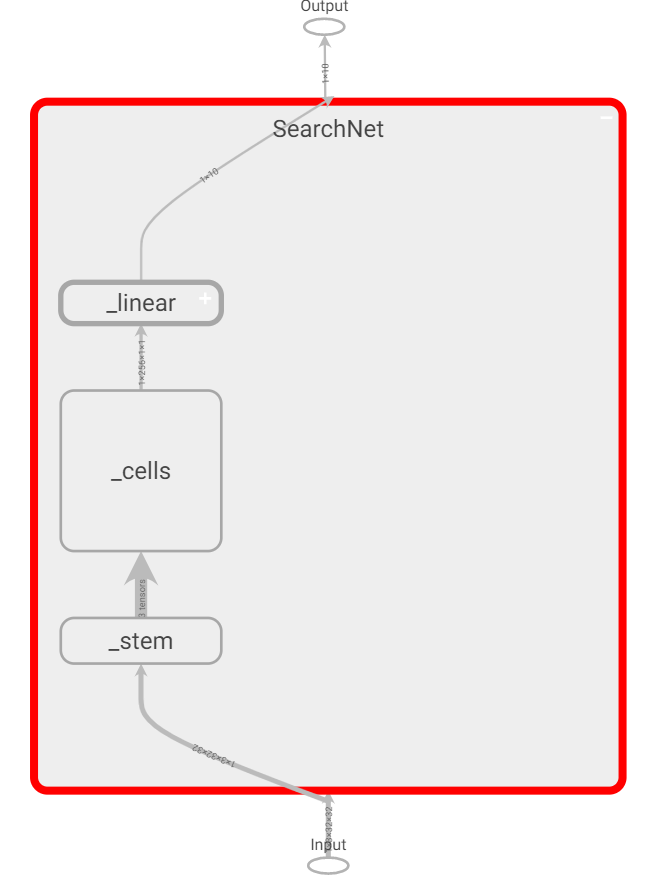
Graph visualization
One of the strongest features in NNablaNAS is its ability to visualize the whole computational graph. This is quite useful for debugging complex model architectures.